Hinal Jajal
Applied Mathematics Student, UCLA
hinaljajal [AT] ucla.edu
Racial Disparities in State Level Criminal Sentencing
Uncovering patterns of racial bias in the sentence length assignments in Virginia
This article draws from a technical report I co-authored with Prof. Phil Chodrow (Middlebury College).
Overview:We study racial disparities in criminal sentences handed down in the state of Virginia during the period 2017-2020. Our data comprises 2.4 million cases from the VA Criminal and Civil Case Portal, which we combine with a smaller, collected data set of 75,000 cases from the VA Sentencing Commission Sentencing Guidelines. Our final data for analysis contains 60,000 cases.
We find that, in this data set, Black defendants receive sentences that are, on average, \(10\%-16\%\) longer than White defendants, even after controlling for gender, age, criminal charge code section, trial type, year, judge, and presence of criminal history. We find further that this disparity is not primarily a feature of judge bias, but rather a consequence of Black defendants having consistently higher guideline sentences attached to their cases. Guideline sentences associated to drug-related charges, particularly possession and intent to distribute, are primary sources of this disparity. We find that Black defendants are more likely to be charged with intent to distribute compared to White defendants, even after controlling for possession of the same types of drugs and combinations of drugs. We find further that Black defendants, charged with either possession or intent to distribute, still receive sentencing guidelines higher than their White counterparts on average. Our findings leave open two hypotheses. Either (a) drug cases with Black defendants consistently have non-race-related features that drive higher guidelines, such as drug quantity and subtype, or (b) there is considerable racial bias in how sentencing guidelines related to drug charges are formulated and used.
Data Sources:We create a database that contains information about criminal sentencing in Virginia, which includes the defendants' demographics, the judges' names, the sentence given, and the recommended sentence. A summary of the data acquisition pipeline is provided, but a more detailed version can be found in the supplementary information section. The dataset is compiled using three public sources: Virginia Judiciary Online Case Information System (Virginia OCIS), Virginia’s Individual Circuit Court Home Pages, and Virginia Criminal Sentencing Commission’s Sentencing Guidelines Data (VCSC). The figure below represents the data pipeline used to consolidate the final dataset.
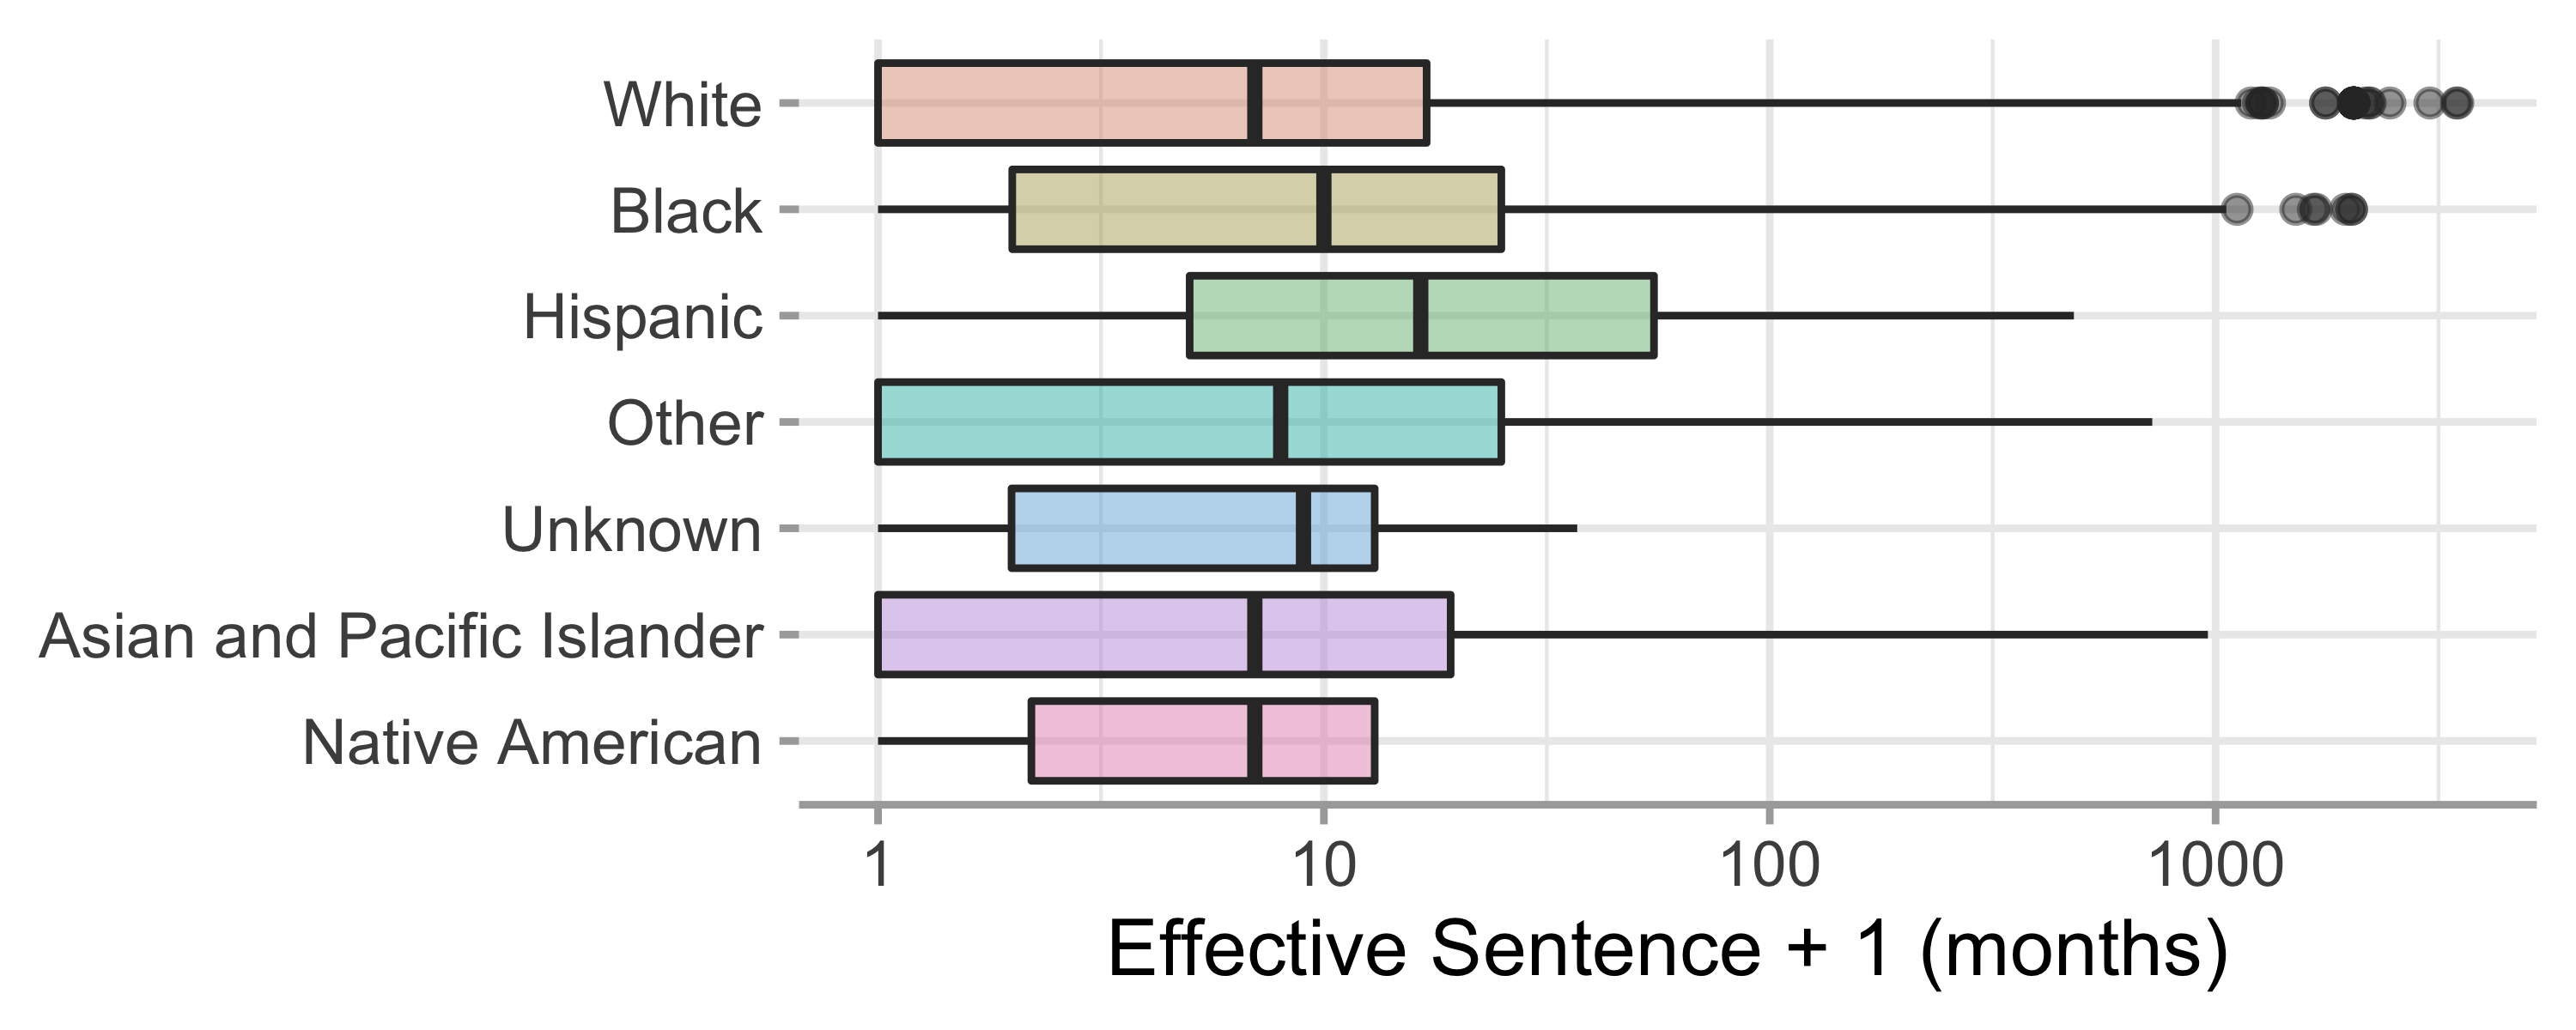
Findings:There are considerable racial disparities in the lengths of effective sentences handed down in our data set. The mean sentence for White defendants was 23 months long, compared to 27 months for Black defendants. The median sentence for White defendants was 6 months, compared to 9 for Black defendants. In our data, 26% of White defendants received an effective ``sentence'' of zero months, compared to just 20% of Black defendants. Fig. 1 gives boxplots for each of the racial groups represented in our data, showing that the overall distribution of sentence lengths for Black defendants is shifted up relative to that of White defendants. We observe that, while this figure also suggests major sentencing disparities for Hispanic defendants, our data contains vastly more records for Black and White defendants than for any other racial group. We therefore focus on Black/White disparity in most of our proceeding analyses.
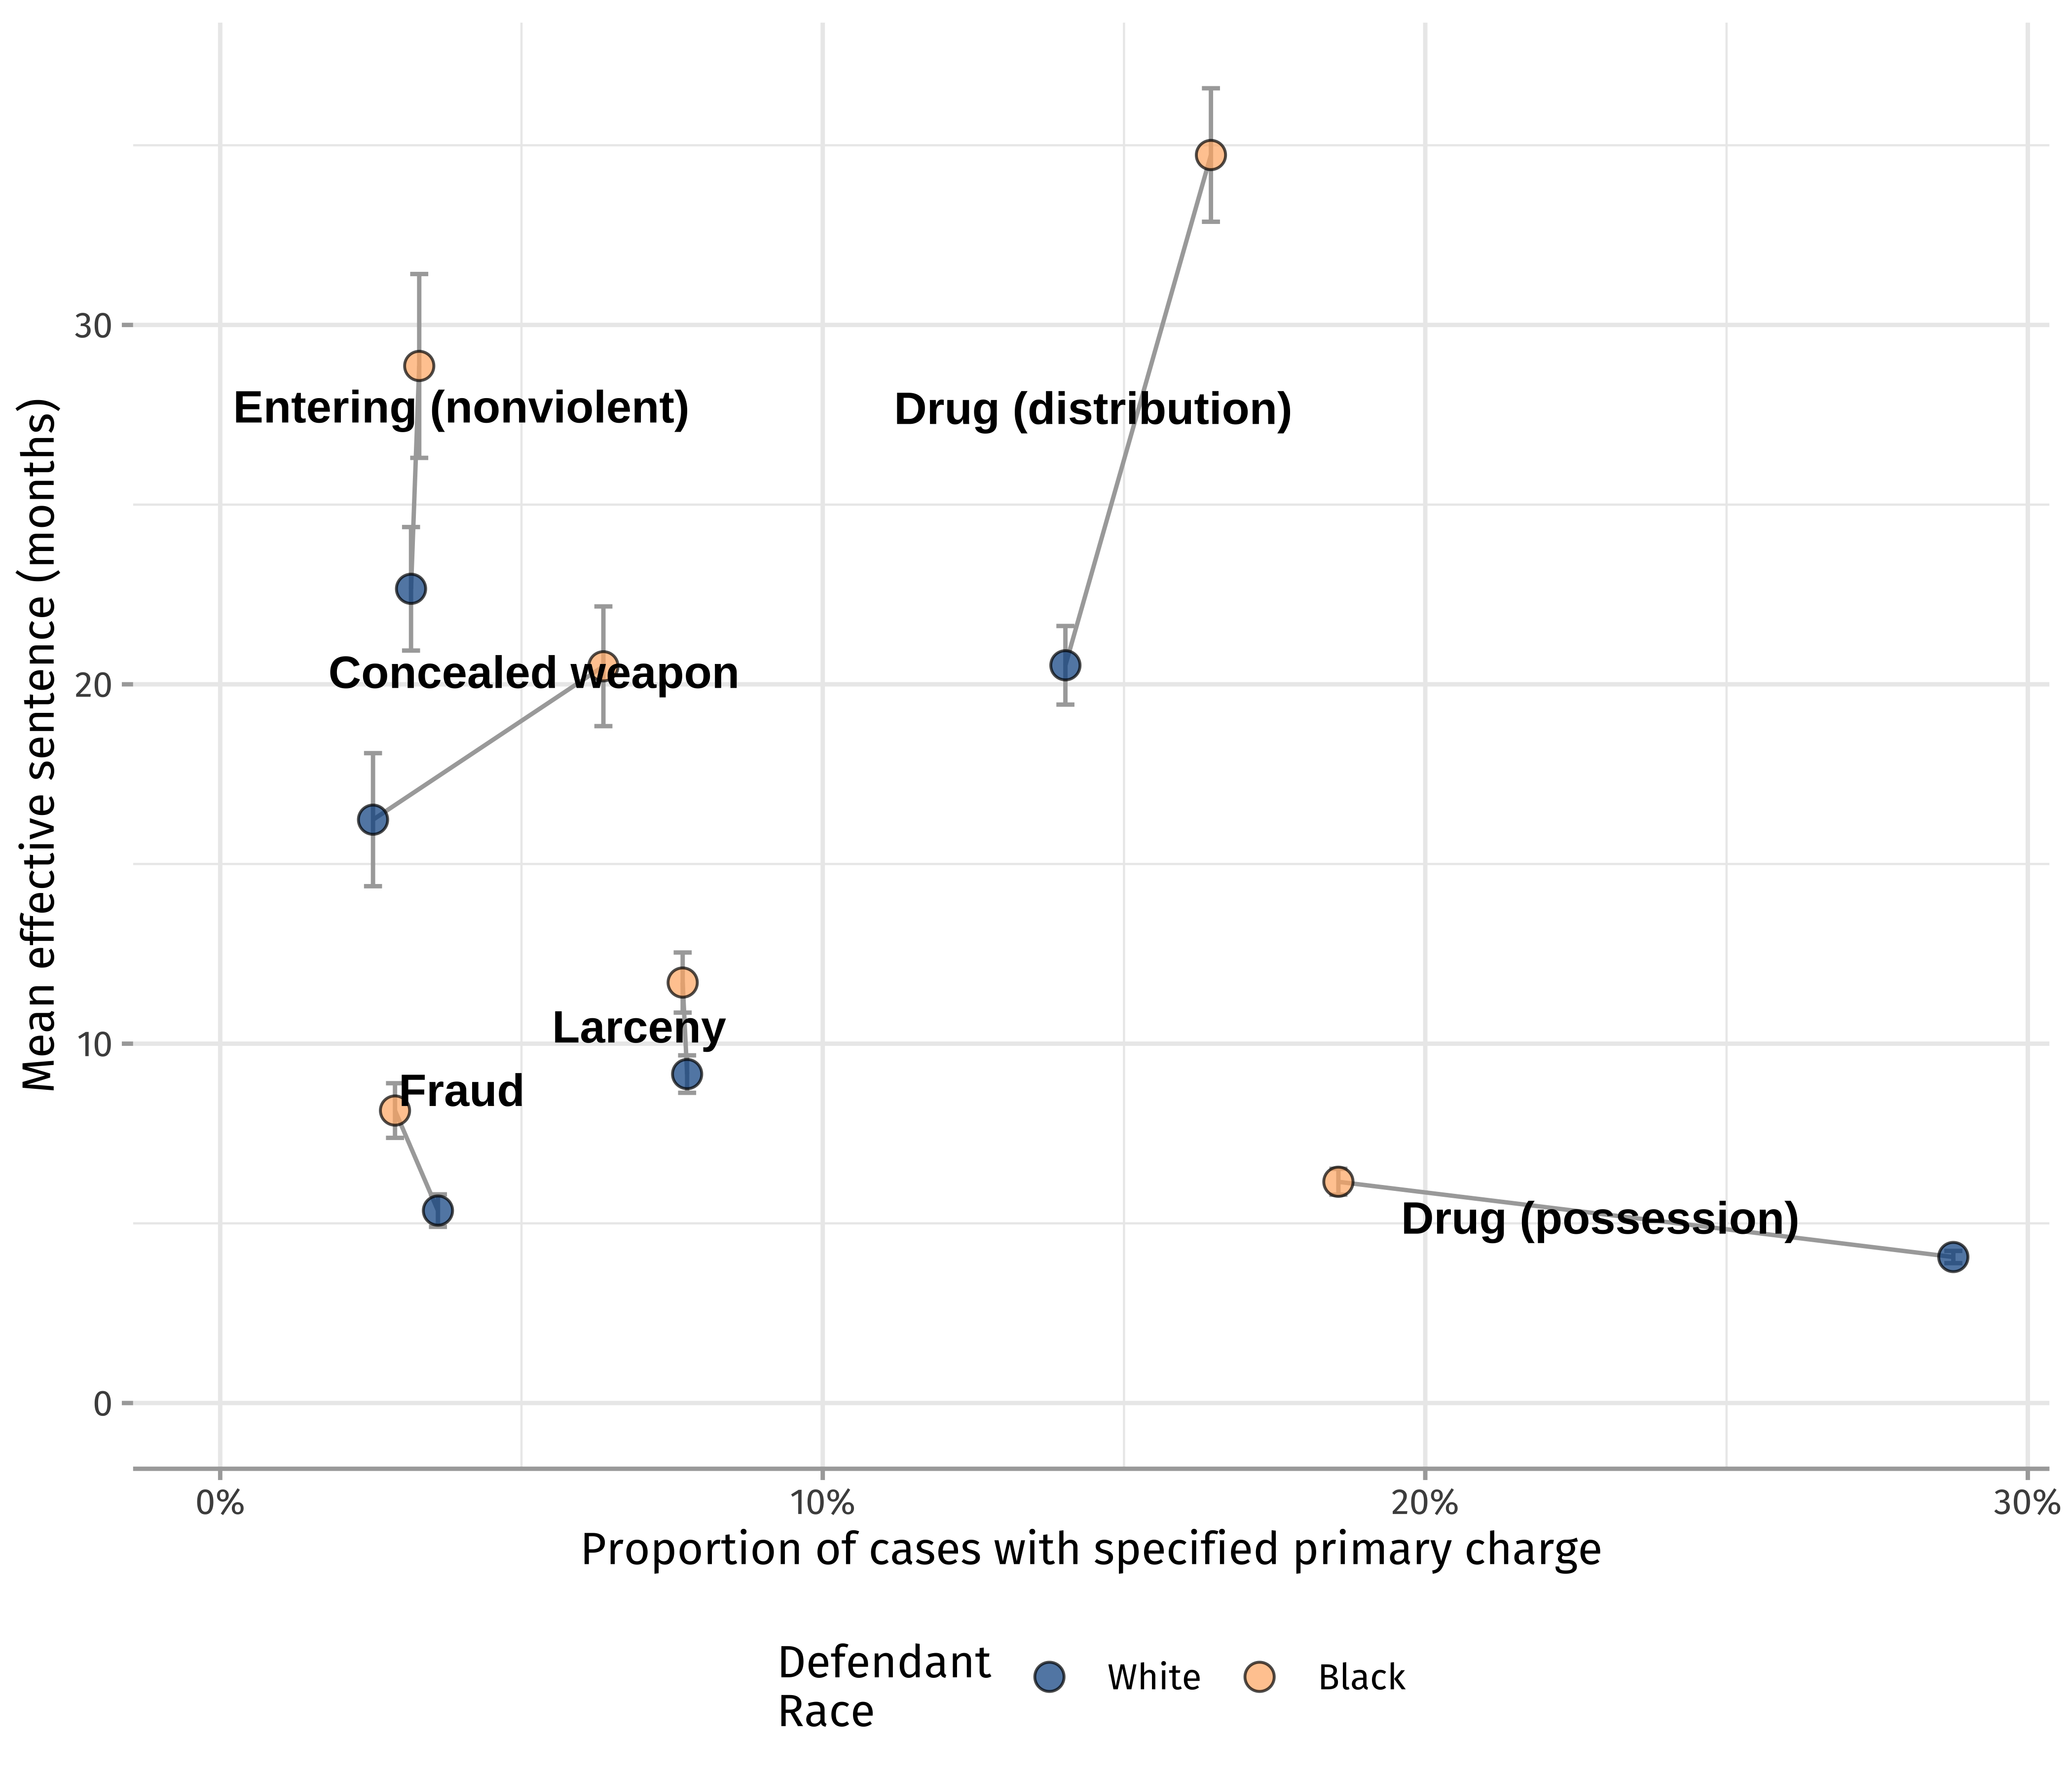
Furthermore, looking at the distribution of the number of cases for each type of crime and race of the defendant, we observe differences both in the charges pressed against Black and White defendants, and the effective sentences they receive. For example, in 37% of cases overall, the primary charge is related to Schedule I or Schedule II drugs. These charges, however, are not equally distributed between White and Black defendants; 41% of cases involving a White defendant have such a primary charge, compared to 32% of Black defendants (Fig. 2). A greater proportion of charges against Black defendants involve fraud, assault, weapon possession, and robbery. It is important not to interpret these patterns of charges as implying that White defendants are more prone to drug use and Black defendants more prone to fraud or violence; rather, we interpret them as evidence that fraud and violence are policed and prosecuted with greater zeal against Black defendants than White ones. Importantly, we observe that Black defendants tend to receive higher sentences in many of these primary offense types. Despite drug charges constituting a greater proportion of charges brought against White defendants, Black defendants receive consistently higher sentences for these charges. Indeed, obscenity is the only primary offense type which is (a) proportionally more common and (b) significantly more severely sentenced for White defendants than Black ones.
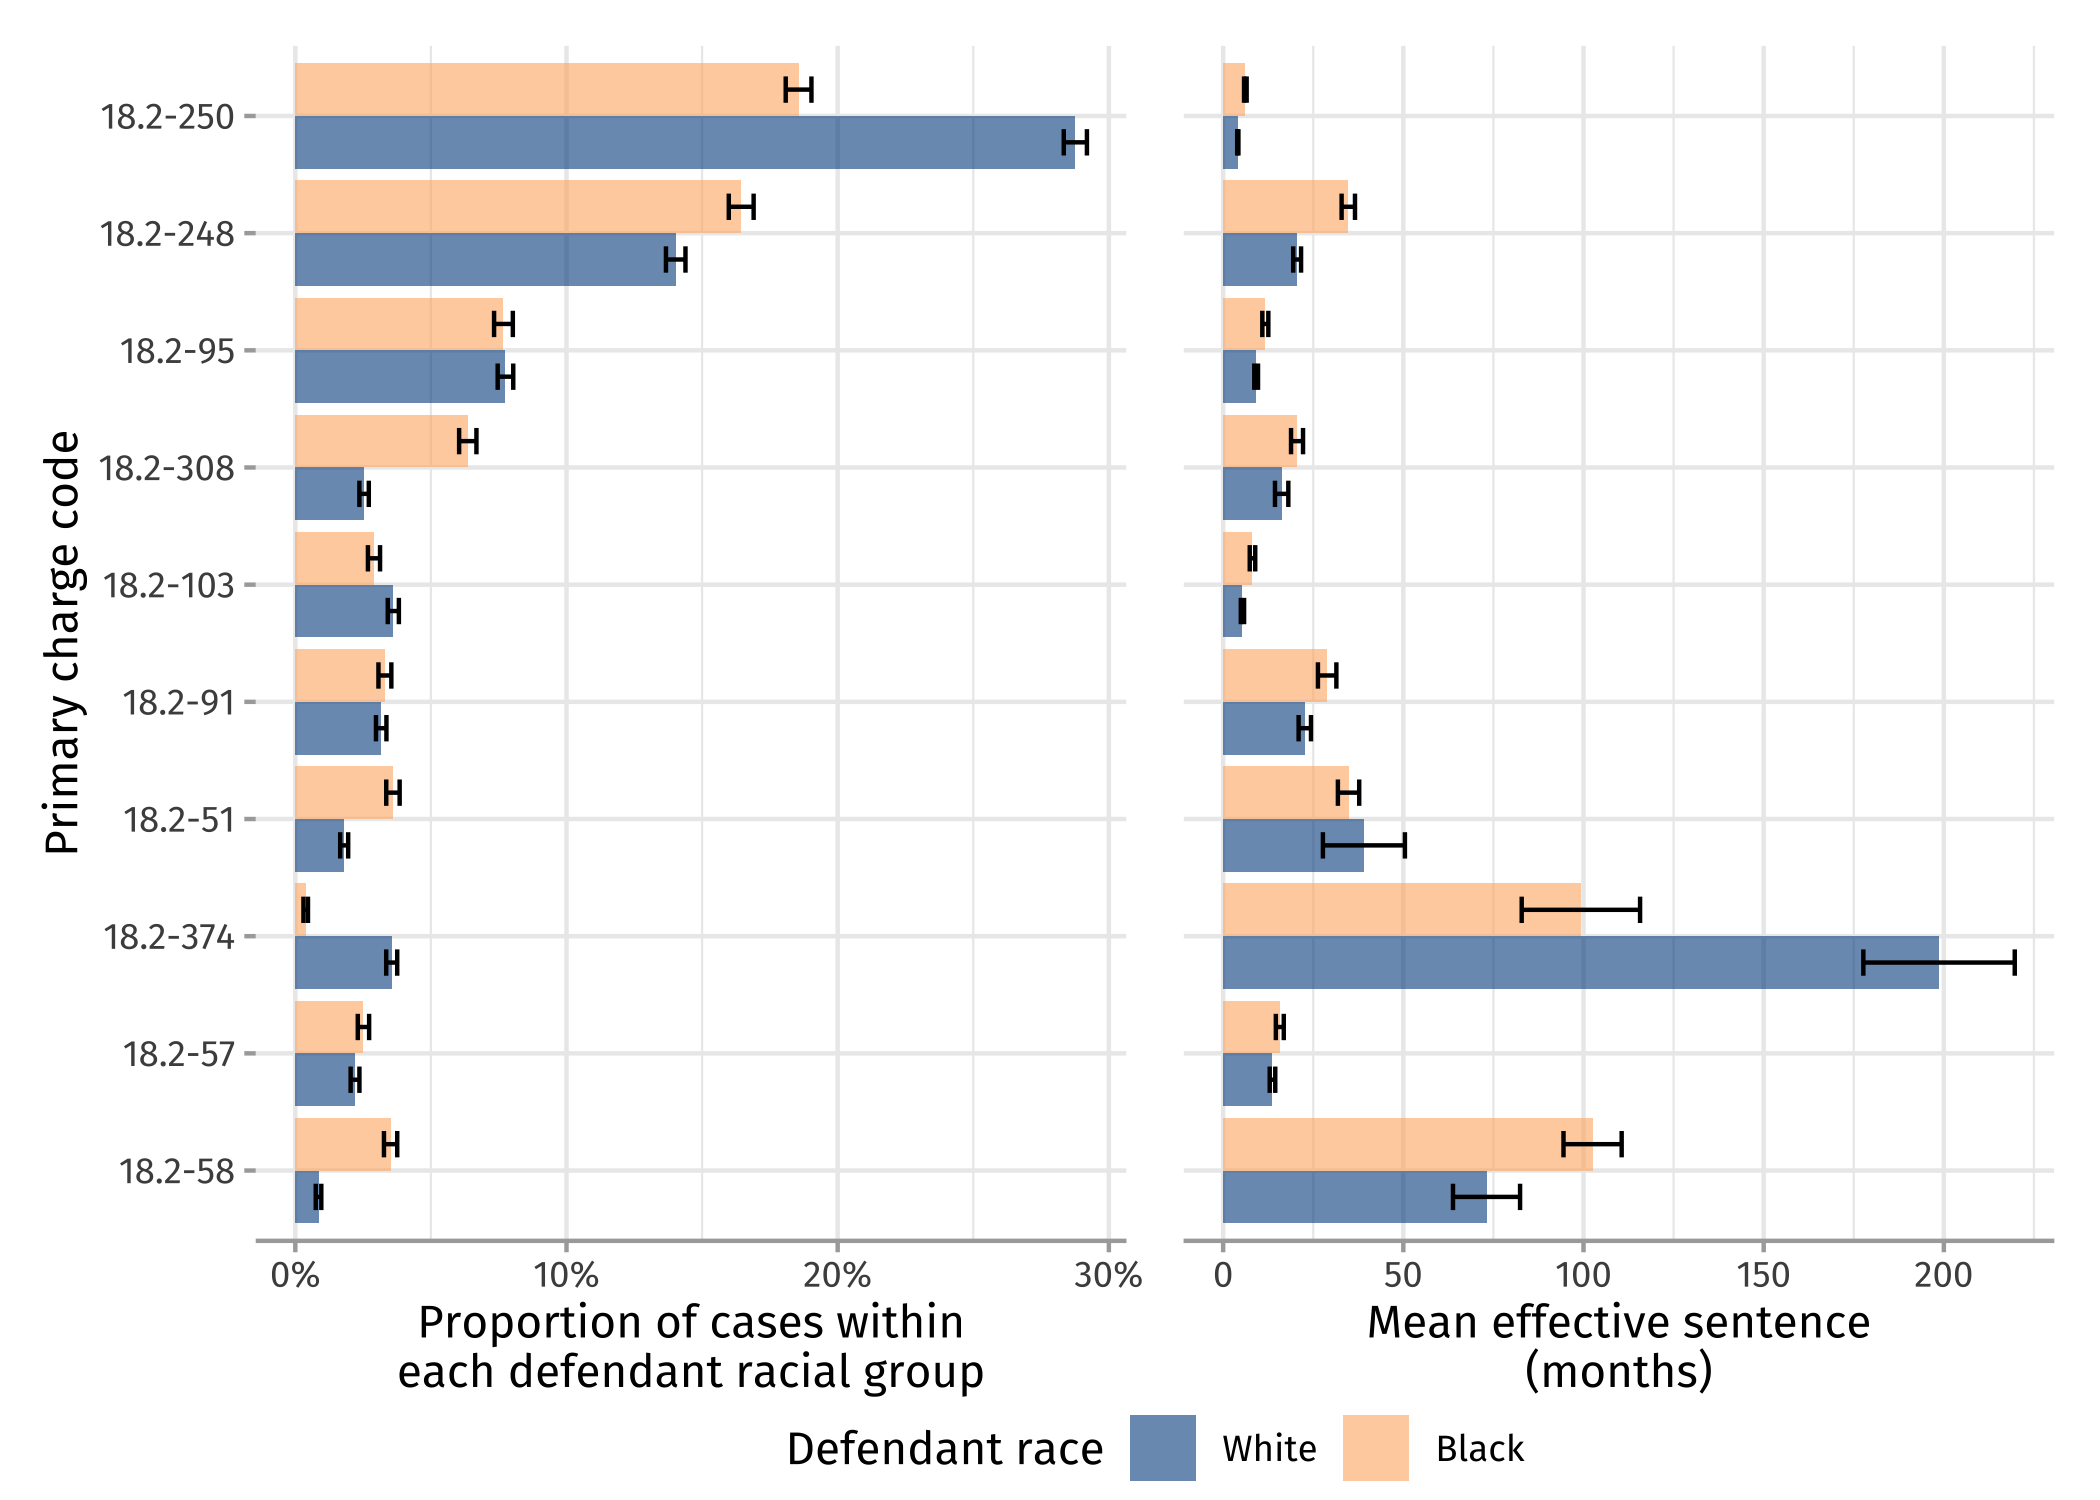
Errorbars give two standard errors in each estimate.
Codes marked with a star have a difference in mean
effective sentence by race with \(p< 0.05\) under a two-sided Welch's \(t\)-test.
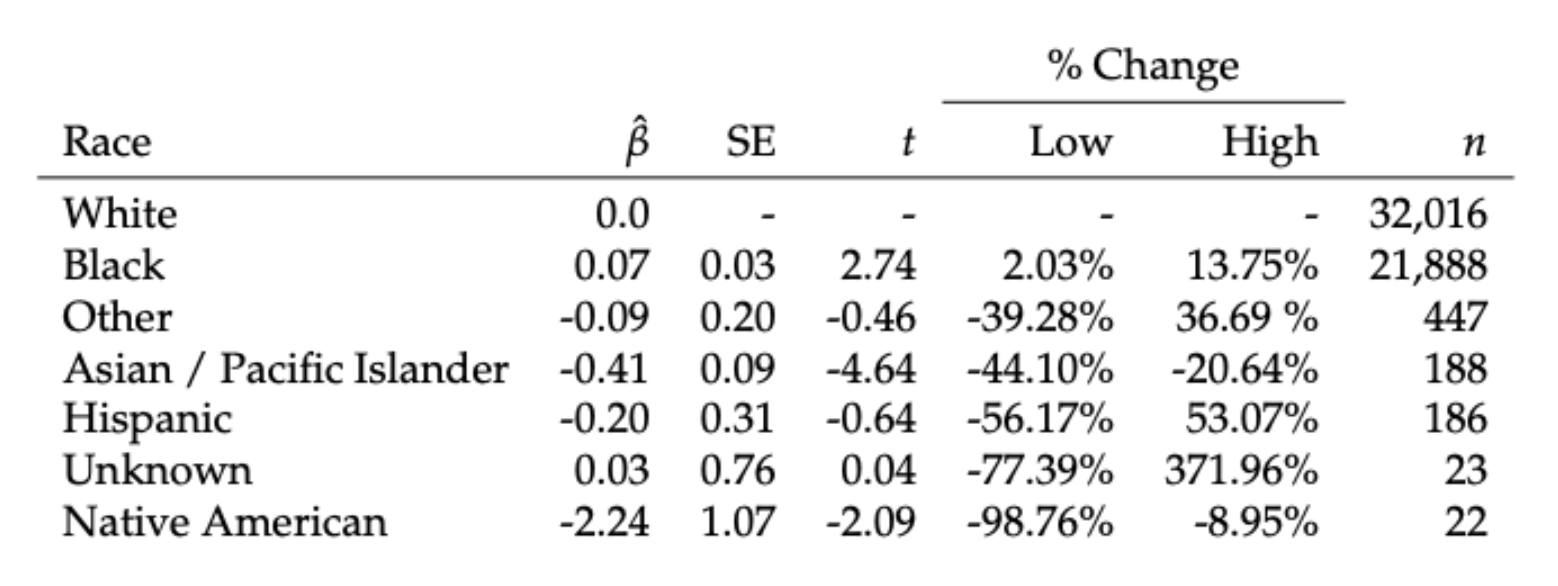
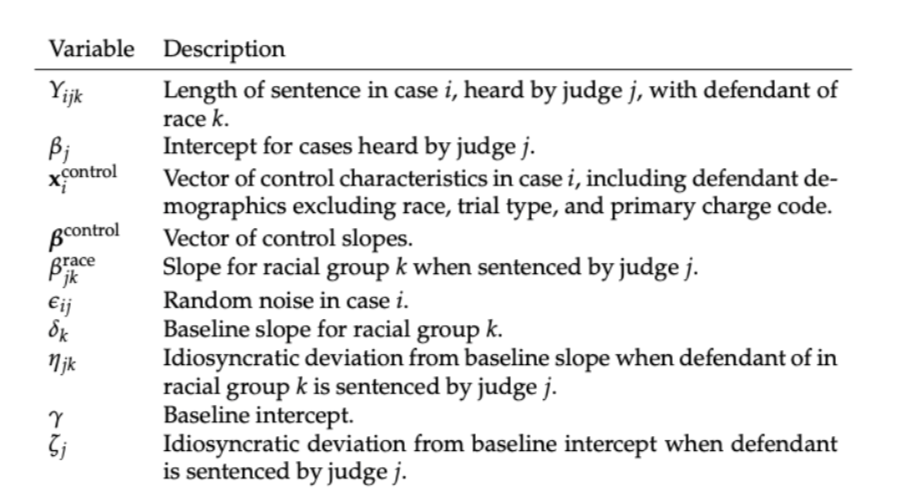
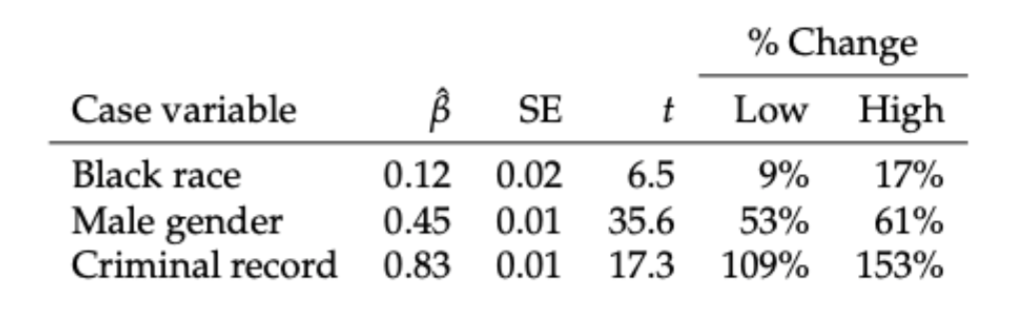
We find that race predicts sentence length, even after controlling for defendant identity, history, crime type, and judge. We first fit a model of the form $$\begin{align} \log(1 + Y_{ijk}) &= \beta_{j} + \mathbf{x}^{\mathrm{control}}_{i}\cdot \boldsymbol{\beta}^{\mathrm{control}} + \beta^{\mathrm{race}}_{jk} \tag{Level 1} + \epsilon_{i} \label{eq:model-basic-sentence-vs-race}\;, \\ \beta_{jk}^{\mathrm{race}} &= \delta_k + \eta_{jk}\;, \tag{Level 2, slopes} \\ \beta_{j} &= \gamma + \zeta_{j}\;, \tag{Level 2, intercepts} \end{align}$$ where each of the symbols appearing in this model are defined in Table 1. In Model 1, the control attributes \(\mathbf{x}_i^{\mathrm{control}}\) for case \(i\) include the age, gender, and presence of criminal history of the defendant, as well as the primary charge code section, trial type, and year of the sentenced offense. Selected coefficients from this model fit are shown in Table 2. The estimate for Black defendants, however, is clearly significant, and corresponds to average sentences that are 10%-16% longer than their White counterparts after accounting for controls. Our primary analytical task is now to evaluate hypotheses that could explain this observed difference.
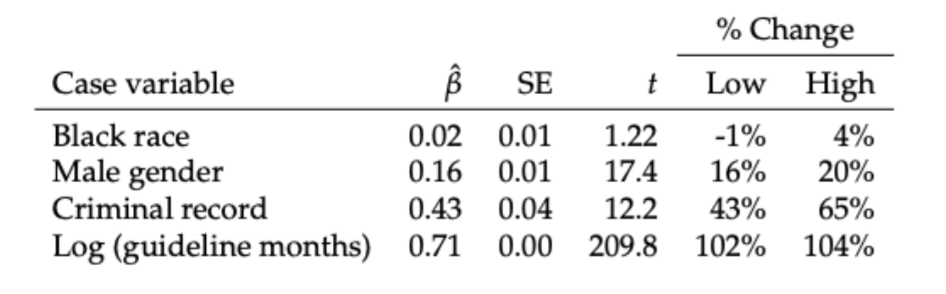
However, the disparity identified by Model 1 can be almost entirely explained by disparity in guideline sentences. In Model 2, we incorporate the lower bound of the guideline sentence as a control variable in \(\mathbf{x}_i^{\mathrm{control}}\). The model is otherwise identical to Model 1. Table 3 summarizes the coefficients for the effect of each racial group on the sentence length in Model 2. After controlling for the guideline, the coefficient of Black is much smaller and no longer statistically distinguishable from 0. The estimated percentage change in the sentence provided to Black defendants is between -0.5% and 3.2% as compared to the sentences given to White defendants with the same case characteristics. In further analysis, incorporating guideline sentences while omitting charge code and presence of criminal history further reduces the estimated effect of race. We therefore conclude that, although considerable sentencing disparities exist in the Virginia court system, these disparities are more likely due to how guideline sentences are assigned than to implicit or explicit racial animus on the part of judges.
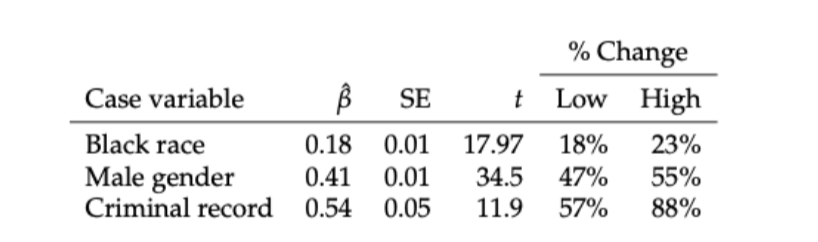
Because racial disparities in sentencing are largely explained away by guideline sentences, we next investigate the hypothesis that the guidelines themselves reflect racial disparities. We fit a simple linear regression model of the form $$\begin{align} \log(1 + Z_{ik}) = \beta + \mathbf{x}_i^{\mathrm{control}}\boldsymbol{\beta}^{\mathrm{control}} + \beta_{k}^{\mathrm{race}} + \epsilon_i\;, \label{eq:guidelines-model} \end{align}$$ where \(Z_{ik}\) is the low guideline sentence in case \(i\) with defendant in racial group \(k\). The control variables are the same as in Model 1. We find that the defendant's race is a strong predictor of the guideline sentence, with Black defendants receiving guideline sentences 18%-23% longer after controls (Table 4). Given this evidence of the presence of racial disparities in the guidelines themselves, we now shift our focus to understanding the specific aspect(s) of the guideline that can explain the bias.
In exploring the role of the worksheets, we discover that black defendants are more likely to receive higher scores and lower rates of nonviolent risk assessment (NVRA) adjustments.
Furthermore, some of the largest disparities are observed in charge codes related to drug possession (18.2-250) and distribution (18.2-248). The two most common charge codes in our data set are:
- §18.2-250: Possession of controlled substances
- §18.2-248: Manufacturing, selling, giving, distributing, or possessing with intent to manufacture, sell, give, or distribute a controlled substance or an imitation controlled substance
for the six most common charge codes.
Together, these codes account for \(59\%\) of all cases in the merged data.
Error bars give two standard errors from the mean.
Furthermore, these disparities are not explained by the types of drugs allegedly involved in the case. The figure below shows the number of cases falling under either §18.2-250 or §18.2-248; the proportion of these that were charged with §18.2-248 specifically; and the mean guideline sentence length for cases with each charge code, broken down by race, gender, and the four most common drugs allegedly involved in the case. Charges related to cocaine are much more common among Black defendants, while charges related to methamphetamine and fentanyl are much more common among White defendants. Across all four drug types, however, Black defendants tend to be sentenced under §18.2-248 at higher rates than White defendants, and male defendants tend to be sentenced under §18.2-248 at higher rates than female defendants. In both §18.2-250 and §18.2-248 Black defendants, especially Black men, tend to receive higher guideline sentences than their White counterparts. In cases in which cocaine was allegedly present, for example, Black men received guideline sentences that are on average twice as long as the corresponding sentences for White men or women regardless of race, within the same charge code. Qualitatively similar disparities are observed for heroin, the other drug type most commonly allegedly involved with cases with Black defendants. Even for fentanyl and methamphetamine cases, which are much more common among White defendants than Black defendants, Black male defendants are still sentenced under §18.2-248 at much higher rates and receive much longer average guideline sentences.
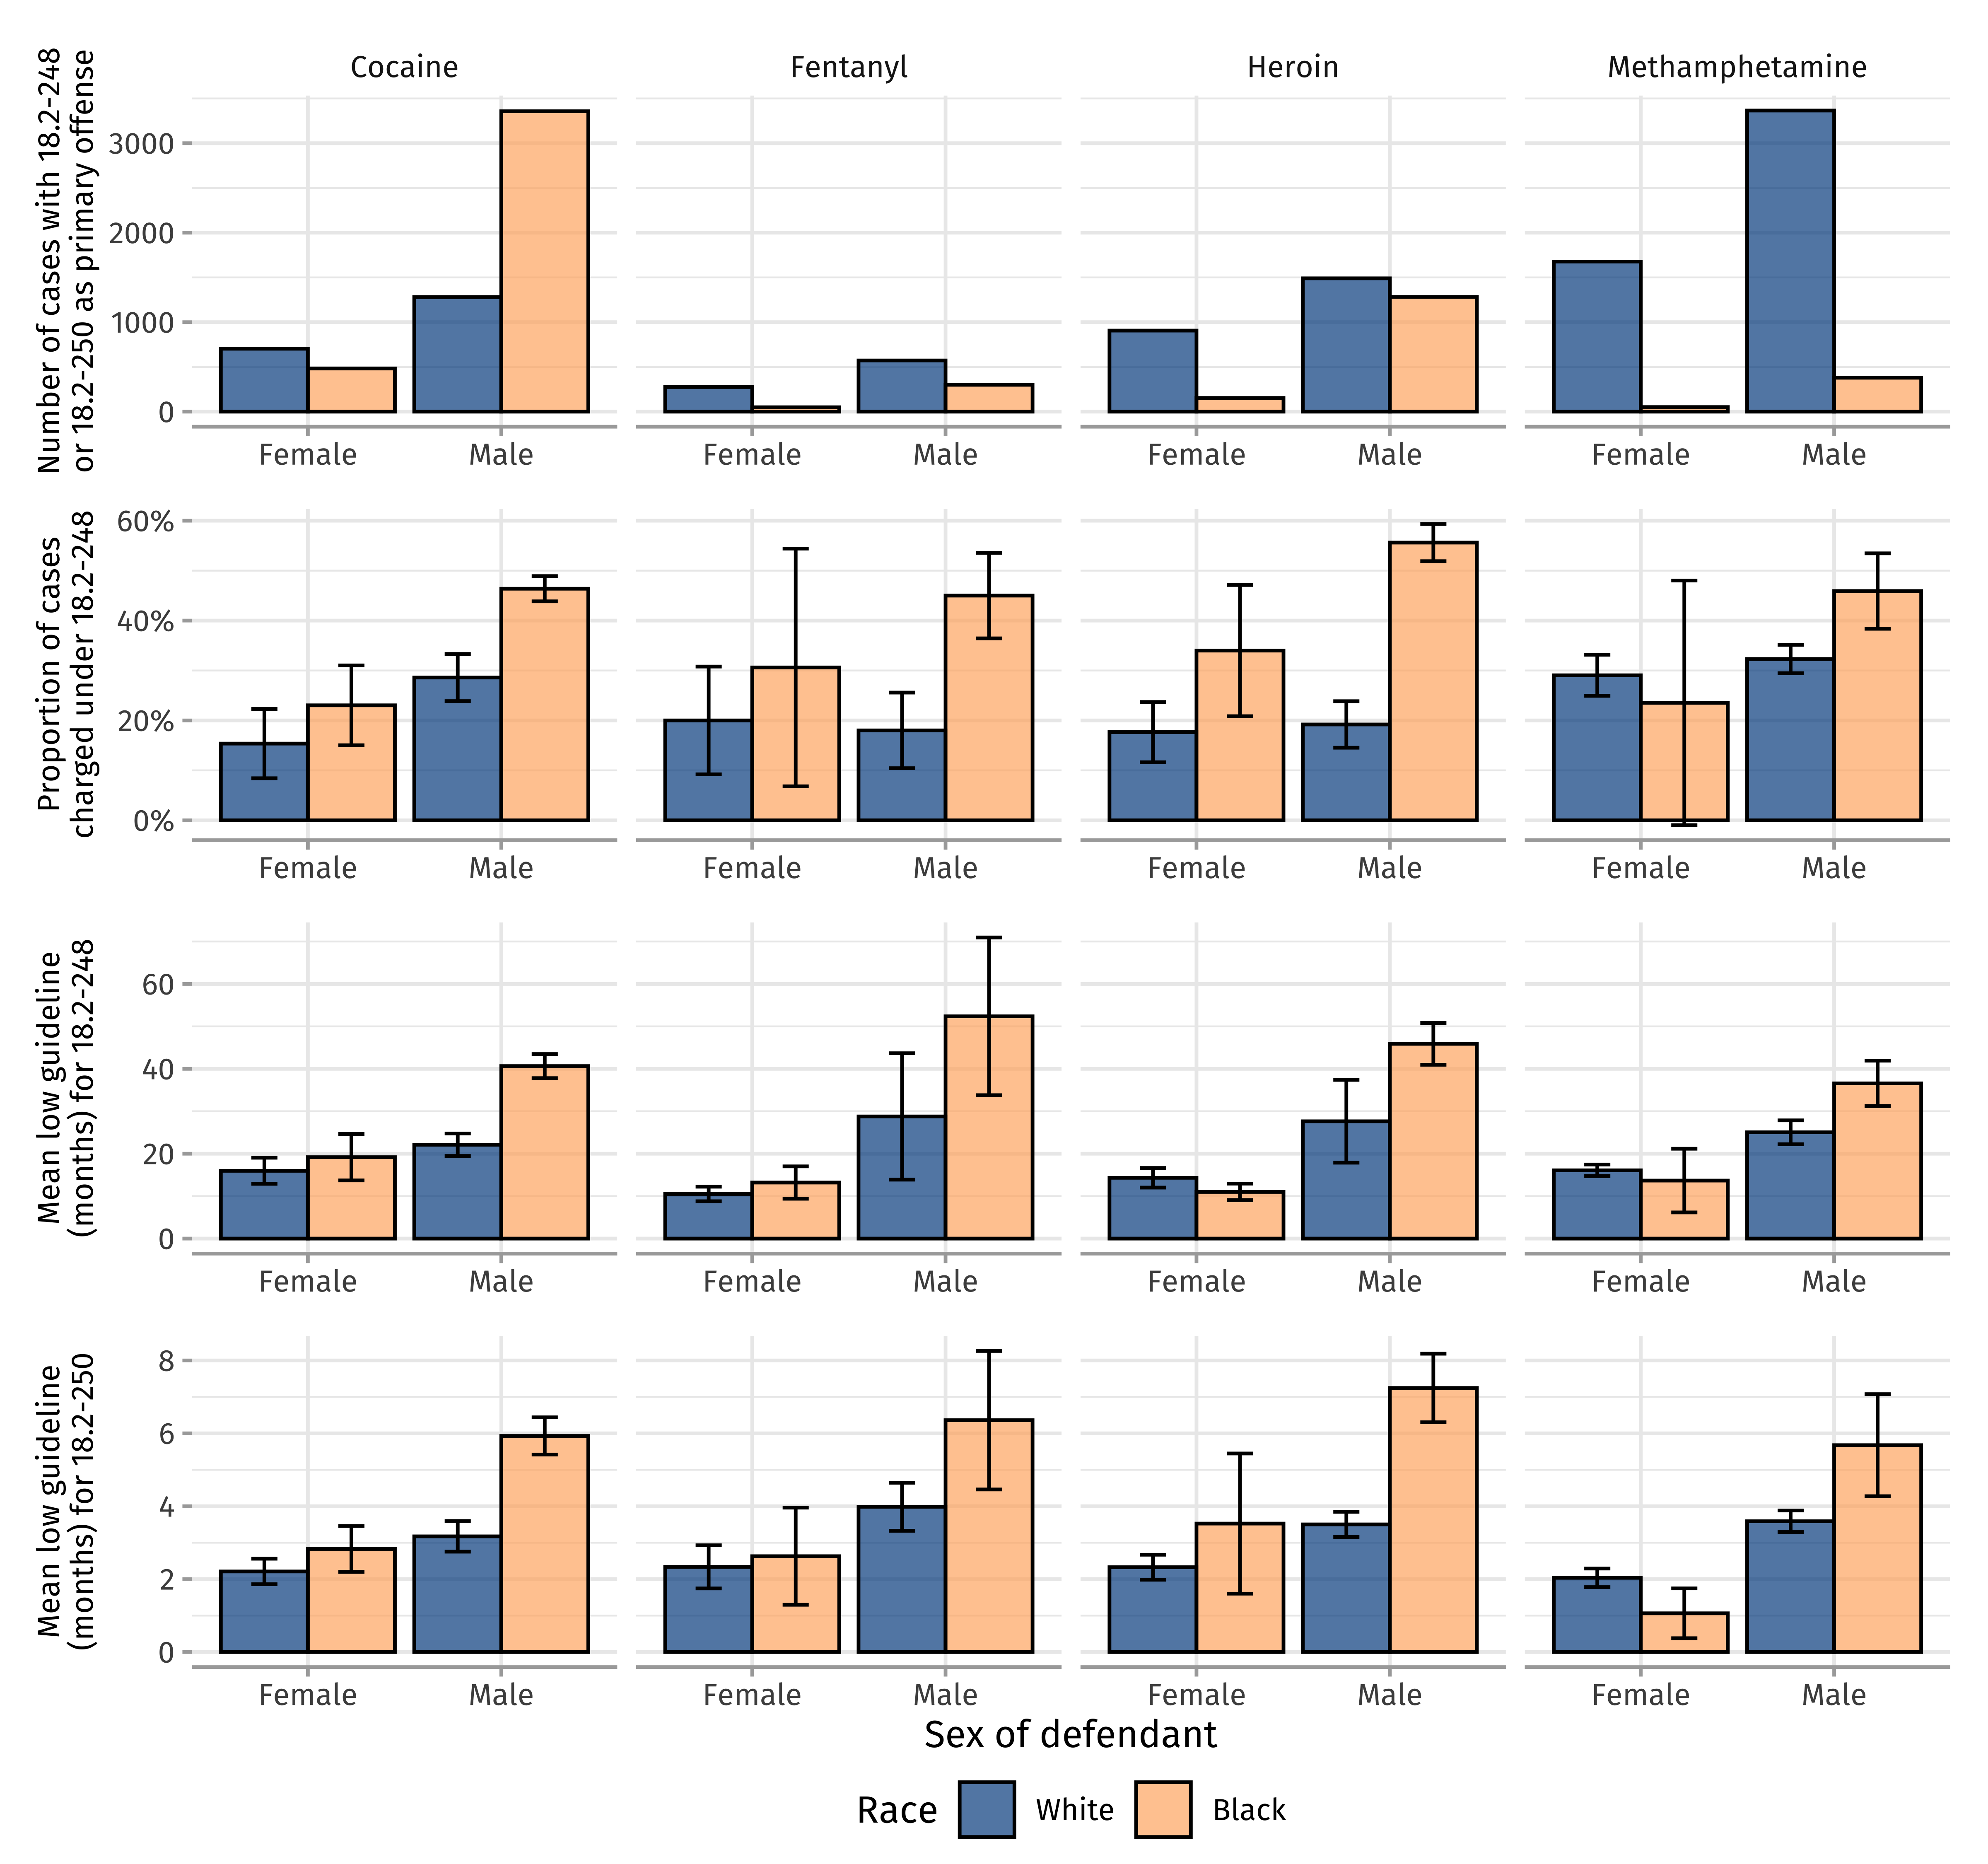
in which each of the four most common drugs in the data were allegedly present.
(Second row): Proportion of these cases charged under code §18.2-248, rather than §18.2-250.
(Third row): Mean low guideline sentence length for cases charged under §18.2-248.
(Fourth row): Mean low guideline sentence length for cases charged under §18.2-250.
Note the difference in vertical scales when compared to the third row.
In the second through fourth rows, error bars give two standard errors from the mean.
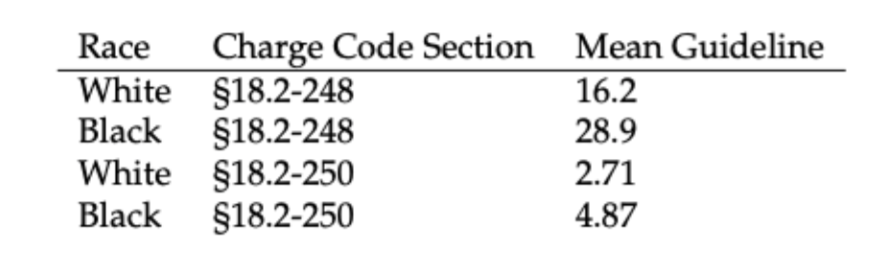
There is evidence of racial disparity in the charge code Black and White defendants are assigned, with the former being charged disproportionately higher for drug crimes related to manufacturing, selling, or distributing (§18.2-248). However, even within the same drug-related charge codes, Black defendants are given higher guideline sentences. Table 6 below summarizes the mean guideline sentence for Black and White defendants within §18.2-248 and §18.2-250. Black defendants receive a mean guideline sentence for each of §18.2-248 and §18.2-250 that is nearly two times greater than the mean for their White counterparts.
We further build on the model predicting the guideline sentence (Model 3) and include the charge code section as a predictor variable. Table 6 below presents the effect of each racial group on the guideline sentence when controlled for the charge code section, sentencing year, and defendant's demographics (age and gender). We observe that the coefficient of Black race reduces as compared to the previous model without controlling for the charge code but remains positive. The combined results of this section and section 3.3.4 suggest that there is disparity against Black defendants both in the assignment of the drug-related charges and in the sentencing within those charges.